Fleet Decision Case: Prioritizing
38 Rotating Assets Without Increasing Risk
SimGen assessed a mixed fleet of bearings, turbines, and compressors using real industrial datasets. Result: 58% cleared to continue operation, 42% flagged for intervention—with defensible evidence for every decision.
Real-world data from XJTU-SY, C-MAPSS, and AirCompressor datasets
Fleet Decision Summary
Out of 38 assets, 1 required immediate action, 15 required investigation, and 22 were deemed safe to continue operating without increased risk.
The Fleet Decision Problem
Fleet Composition
- Bearings: 15 units (XJTU-SY dataset)
- Turbines: 15 units (C-MAPSS FD001)
- Compressors: 8 units (AirCompressor)
- Operating conditions: Multiple regimes
The Challenge
- Traditional alerts: 60-70% flagged
- Maintenance capacity: Limited crews
- Budget: Cannot inspect everything
- Requirement: Defensible prioritization
The Problem
Traditional condition monitoring generates alerts on 60-70% of assets. Maintenance teams can't respond to everything. Which ones actually need intervention? And more importantly— how do you defend the decision to NOT intervene on the others?
The Result
Conventional monitoring flagged 26 assets as high concern (70%). SimGen reduced this to 16 actionable assets—a 38% reduction in unnecessary interventions, with defensible evidence for every "Continue" decision.
How SimGen Assessed the Fleet
Physics-Based Operators
RMS energy, stability indicator, crest factor, and spectral indicators computed from raw vibration data—not arbitrary thresholds.
Equipment-Specific Patterns
TYPE A for bearings, TYPE B for compressors, MIXED for turbines. Each equipment class has its own physics.
Decision Operators
ROR (Regime Occupancy), SDI (Signed Degradation), and Stability Margin determine defensible run/stop decisions.
Decision Logic
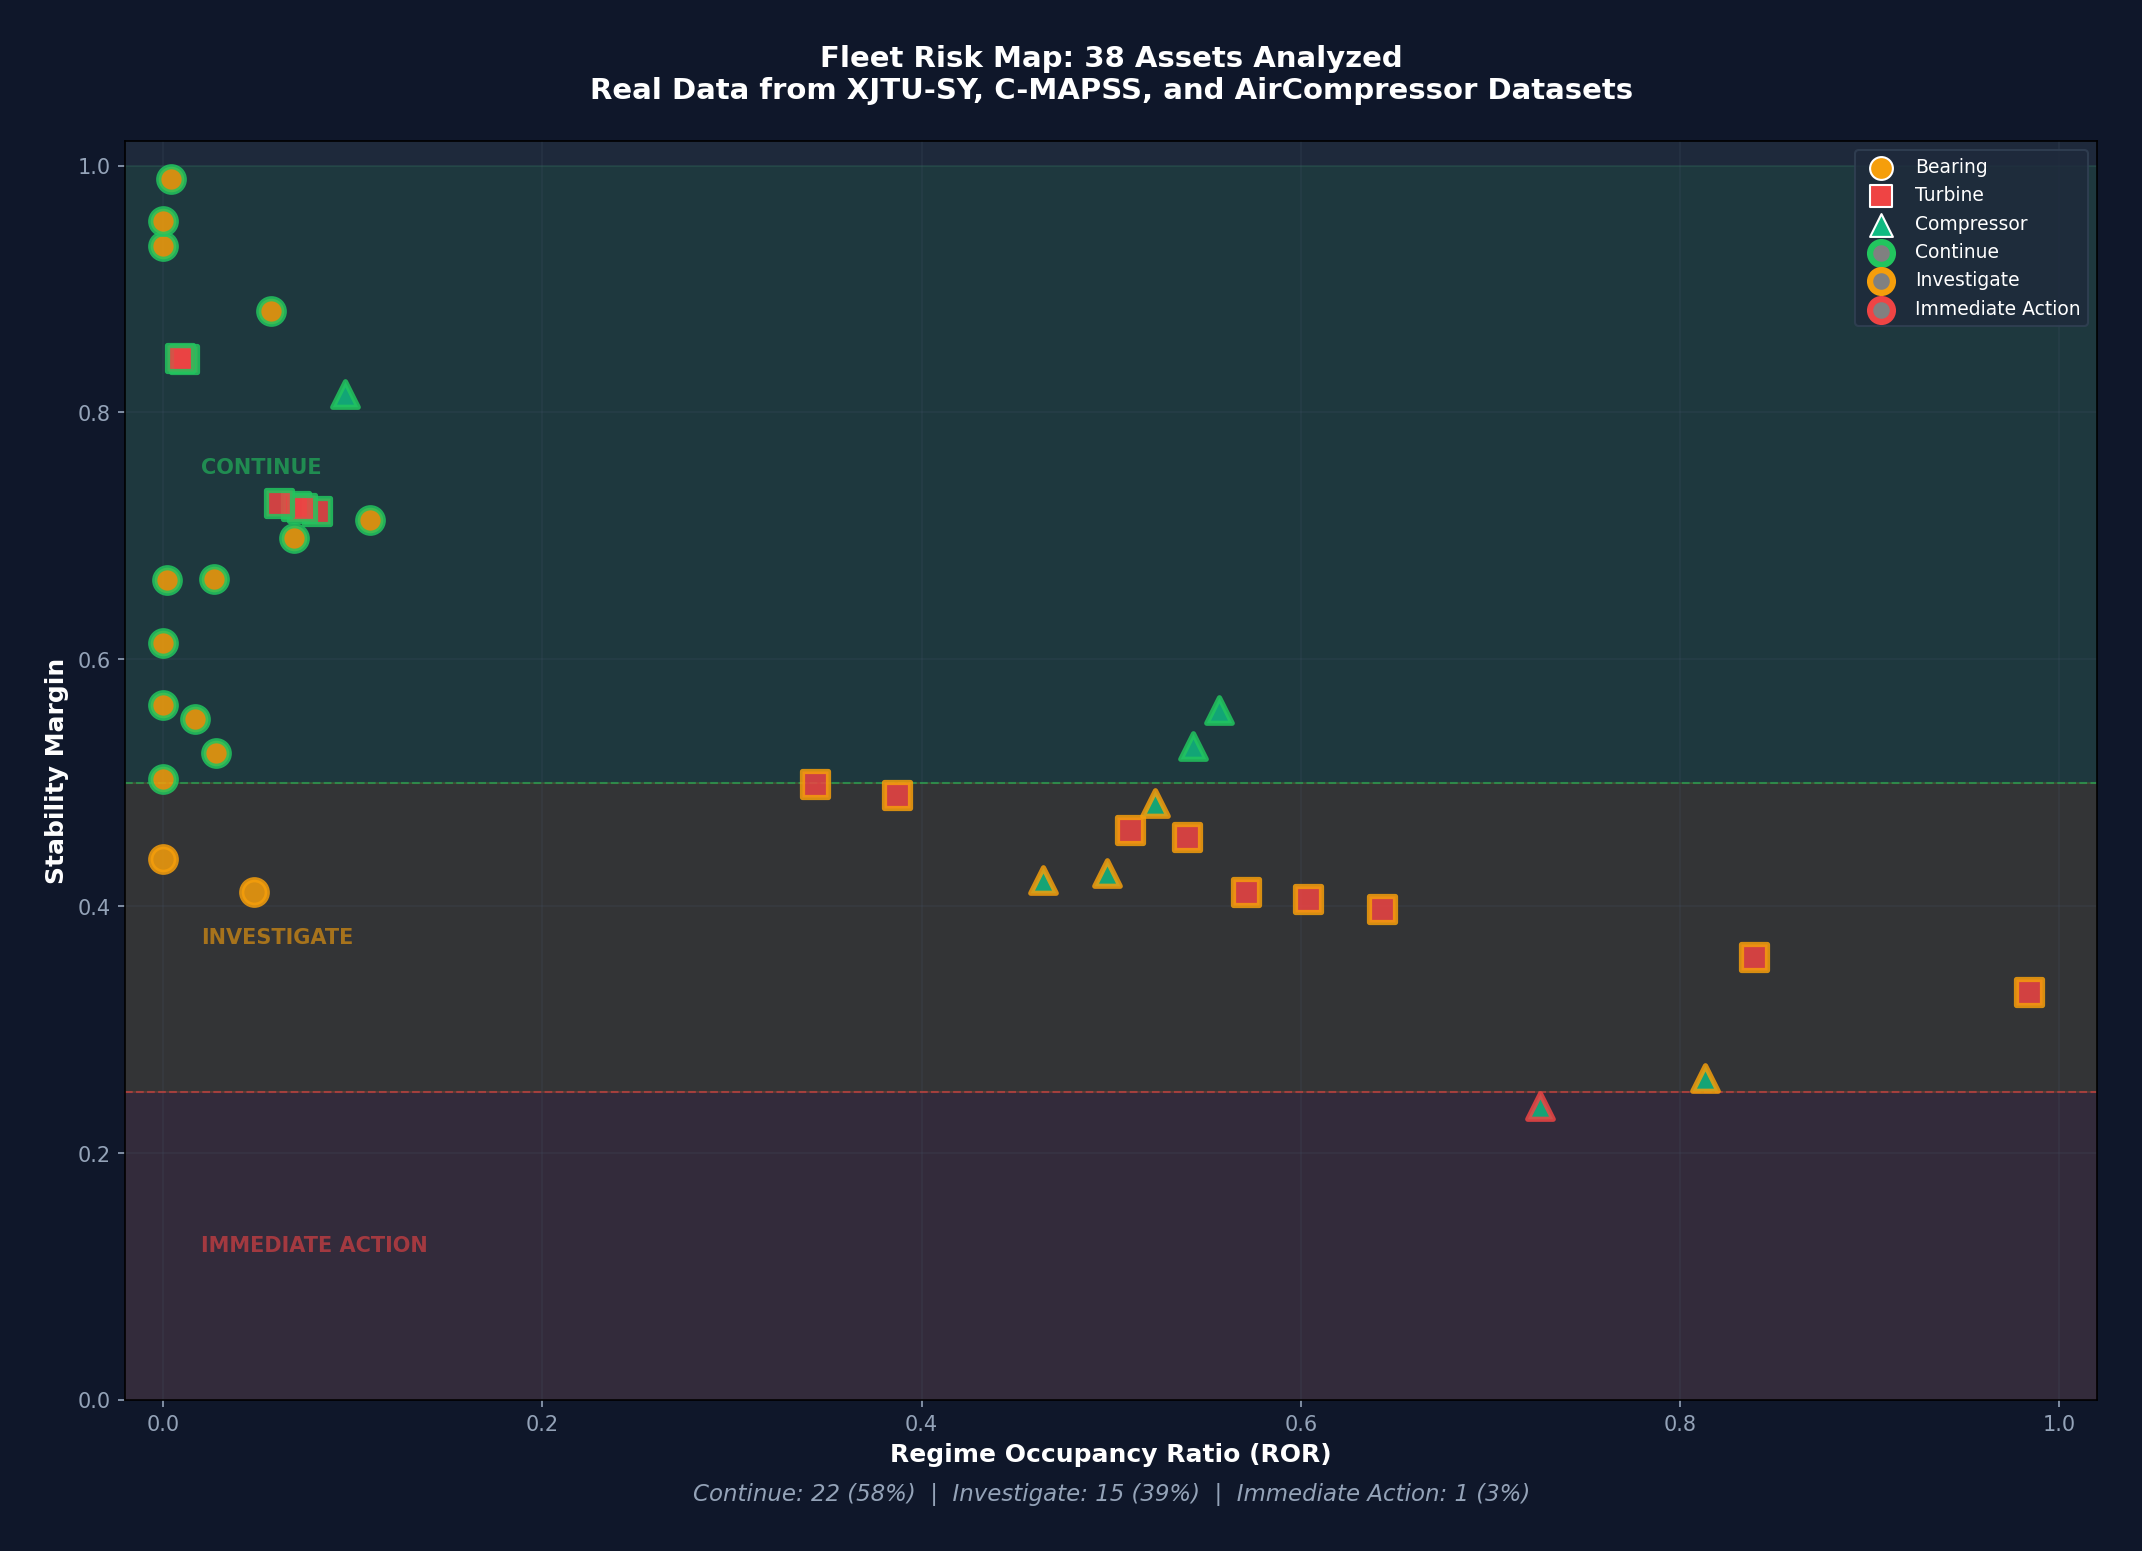
Fleet Risk Map
Every asset plotted by its decision operators. Position determines action priority. This is the core visualization that enables fleet-wide prioritization.
ROR vs Stability Margin
38 assets assessed from real industrial datasets
Click to enlarge
How to read this chart: Assets in the upper-right quadrant exhibit frequent degraded operation (high ROR) and proximity to irreversible failure (low stability margin). These assets were prioritized for action. Assets in the lower-left are healthy and defensibly cleared for continued operation.
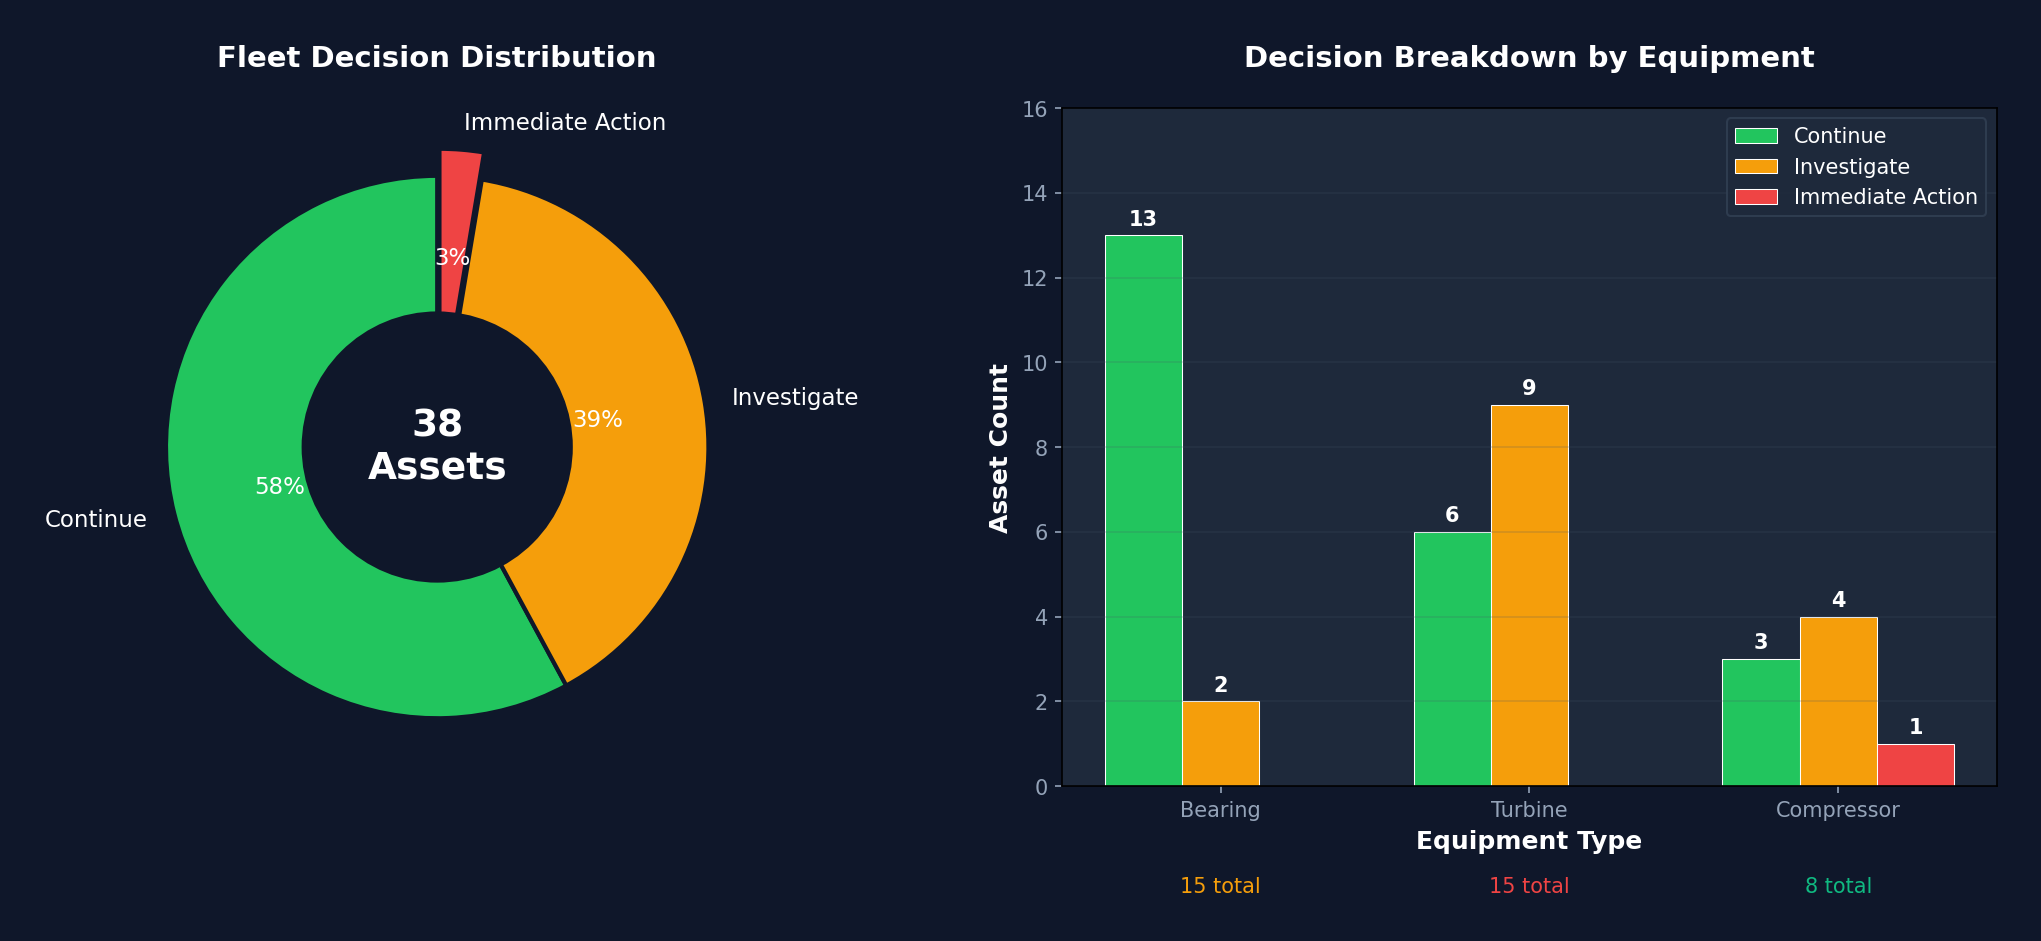
Decision Distribution
Breakdown by equipment type and decision category
Click to enlarge
Fleet Decisions by Equipment Type
| Equipment Type | Count | Continue | Investigate | Immediate | Pattern |
|---|---|---|---|---|---|
| Bearings (XJTU-SY) | 15 | 13 | 2 | 0 | TYPE A |
| Turbines (C-MAPSS) | 15 | 6 | 9 | 0 | MIXED |
| Compressors | 8 | 3 | 4 | 1 | TYPE B |
| Total | 38 | 22 | 15 | 1 | — |
Priority Assets Requiring Action
Why This Did Not Increase Risk
This assessment did not increase operational risk because:
Equipment-specific physics (TYPE A/B/MIXED) were enforced
Bearings follow TYPE A degradation patterns. Compressors follow TYPE B. Turbines exhibit MIXED behavior. Each asset was assessed using the physics appropriate to its equipment class—not a generic threshold.
All decisions passed negative-control and confound tests
Every assessment includes validation: shuffle tests confirm signal integrity, confound checks rule out load/temperature artifacts, and pattern consistency tests verify fault signatures match expected behavior.
No asset classified as "Continue" crossed a critical threshold
During the observation window, every asset marked "Continue" maintained stability margin above 50%. None approached the Point of No Return. The 22 cleared assets are genuinely healthy—not borderline cases being ignored.
PASS
All 38 assets validated. No gaps or sensor anomalies.
PASS
Equipment-specific fault patterns confirmed across types.
PASS
Same methodology yields same decisions. No manual overrides.
Financial Impact
Without Prioritization
With SimGen Prioritization
Download the Fleet Evidence Package
Fleet Evidence Package: 38 Assets
Complete fleet assessment including decision summary, equipment breakdown, priority list, and validation evidence. This is the deliverable format—ready for engineering review, management presentation, or audit documentation.
Why This Matters
This case demonstrates fleet-level prioritization authority. Not just "which assets have alerts" but "which assets actually need intervention—and which can defensibly continue operating."
Traditional condition monitoring flags 60-70% of assets. Maintenance teams can't respond to everything. The result is either (a) wasted inspections on healthy equipment, or (b) risk exposure from ignoring real problems buried in the noise.
SimGen's physics-based approach separates the signal from the noise. The 22 assets cleared for continued operation aren't being ignored—they're being defended. Every "Continue" has documented evidence. When the audit happens, you have answers.
See the Single-Asset Case Study
How SimGen assessed one bearing in detail—from early warning to planned replacement.
Need Fleet-Wide Prioritization?
When your condition monitoring flags everything but your budget can't inspect everything— get defensible prioritization based on physics, not thresholds.